 blog
Best Gold Trading Strategy 2026: Data-Driven Approaches
Table of Contents
- Gold Trading Strategy Essentials for 2026
- Gold Trading for Beginners: Foundation Principles
- Trend Following and Breakout Trading for Gold
- Gold Day Trading Strategy: High-Frequency Approach
- Gold Trading Indicators and Technical Analysis
- Automated Gold Trading: Removing Emotion from Execution
- Macro-Economic Factors Driving Gold Prices in 2026
- Building a Consistent Gold Trading Plan
- Frequently Asked Questions
Last Updated: October 21, 2026
Gold Trading Strategy Essentials for 2026
The gold market moves differently in 2026 than it did five years ago. Volatility patterns have shifted. Central bank policies have changed.
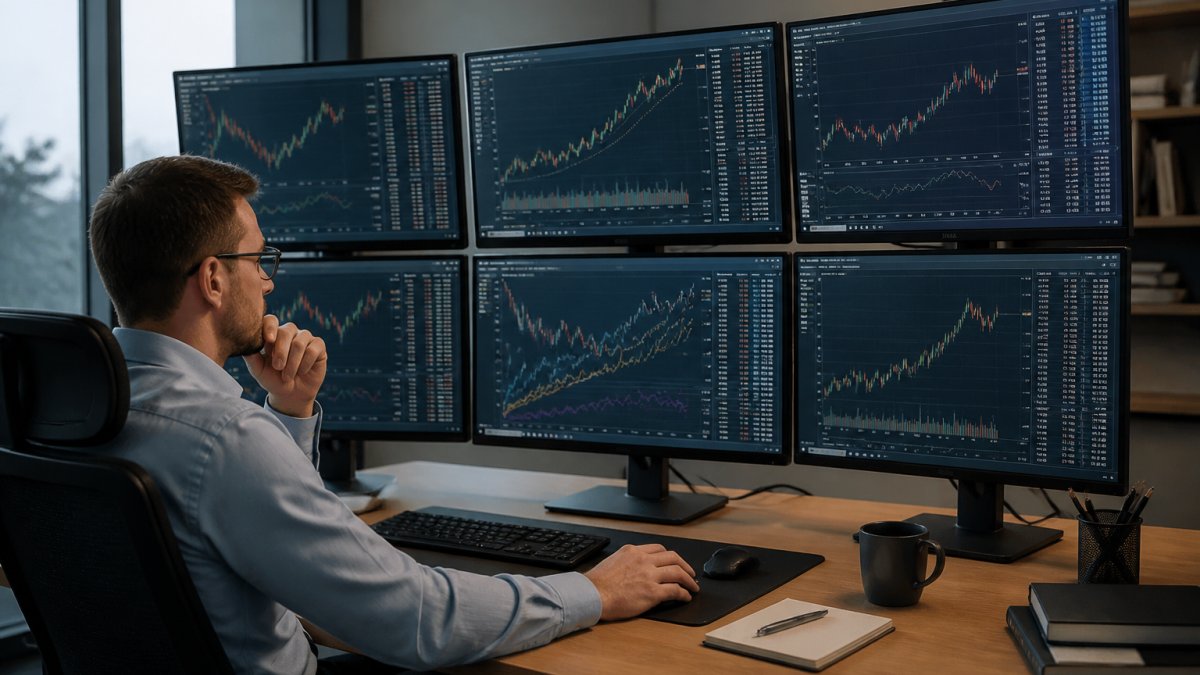
A successful gold trading strategy now requires three things: a clear framework for entry and exit signals, disciplined risk management, and the ability to adapt to macro-economic shifts. This guide covers the best gold trading strategy approaches for 2026, from day trading tactics to automated systems that remove emotion from execution.
Most successful traders follow one of three primary approaches: trend following, range trading, or automated copy-trading. Each has distinct advantages depending on your time availability and risk tolerance.
Gold Trading for Beginners: Foundation Principles
Before you place your first trade, understand what you're actually trading. XAU/USD is the price of one troy ounce of gold quoted in US dollars. It moves based on interest rates, inflation expectations, and safe-haven demand during geopolitical uncertainty.
The foundation of any gold trading strategy rests on three pillars: understanding price action, managing use responsibly, and recognizing when conditions favor your approach.
Understanding XAU/USD Price Action and Support Resistance
XAU/USD price action follows predictable patterns. Gold doesn't move randomly. It respects support and resistance levels, responds to moving averages, and shows clear momentum shifts when macro conditions change.
Support and resistance are price levels where gold historically bounces or reverses. A support level is where buyers step in and prevent further downside.
The most reliable support and resistance levels form at round numbers: 2,000, 2,050, 2,100. Gold also respects Fibonacci retracement levels (23.6%, 38.2%, 61.8%) when markets are trending.
Managing Use and Position Sizing
Use amplifies both profits and losses. A 1% move in gold becomes a 10% move on your account with 10:1 use.
A common mistake is using too much use too early. New traders see that 50:1 use is available and assume they should use it.
Position sizing follows a simple formula: risk no more than 1-2% of your account on any single trade. If your account is $10,000 and you risk 1%, you're risking $100 per trade.
Trend Following and Breakout Trading for Gold
Trend following works in gold markets because gold trends persist. When central bank policy shifts or geopolitical tension rises, gold doesn't reverse immediately. It trends for weeks or months. Traders who identify the trend early and ride it capture the largest moves.
Identifying Breakout Opportunities
A breakout occurs when price breaks above resistance or below support with volume confirmation. Breakouts signal that the previous price range is no longer relevant and a new trend is forming.
The most reliable breakouts happen when price consolidates for several days, then breaks decisively. Consolidation shows indecision. Breakout shows conviction.
Look for these specific conditions: price in a tight range for 3-5 days, volume declining during consolidation, then volume spiking as price breaks the range. This pattern repeats across timeframes.
Entry and Exit Signals
Entry signals come from breakout confirmation. Don't enter at the breakout itself. Enter after price has moved 10-20 pips past the resistance level. This confirms the breakout is real and not a false break that reverses immediately.
Exit signals are trickier. Many traders exit too early, taking small profits while letting losses run. The opposite approach works better: let winners run, cut losers quickly. Set your take-profit at a 2:1 or 3:1 risk-reward ratio.
Gold Day Trading Strategy: High-Frequency Approach
Day trading gold requires active monitoring. You're holding positions for minutes to hours, not days. This approach suits traders with time to watch charts and quick decision-making skills.
Volatility Patterns and Liquidity Windows
Gold trades most actively during New York and London market hours. These overlap periods see the highest volume and tightest spreads.
Volatility spikes at specific times: US economic data releases, Federal Reserve announcements, and central bank policy decisions. These events create sharp moves that day traders exploit.
A practical approach: trade the first 30 minutes after major data releases. The initial move usually continues for 20-30 minutes before profit-taking reverses it. This window offers high probability setups with clear directional bias.
Stop-Loss and Take-Profit Placement
Day trading requires tight stops. Your stop-loss should be 20-30 pips away maximum. Wider stops mean larger losses if you're wrong.
The fix is adjusting your position size to match your stop distance. A 20-pip stop requires smaller position size than a 50-pip stop to maintain your 1-2% risk per trade.
Take-profit placement in day trading is typically 1:1 risk-reward. You risk 20 pips to make 20 pips. This lower ratio works because day trading has higher win rates than swing trading.
Gold Trading Indicators and Technical Analysis
Technical indicators measure price momentum, trend strength, and overbought/oversold conditions. They're not predictive. They're confirmatory. Use them to confirm what price action is already telling you. Refining your entry criteria requires a disciplined selection of technical analysis indicators to filter out market noise and sharpen your focus on high-probability setups.
Moving Averages and Momentum Indicators
The 20-period and 50-period moving averages are the most reliable for gold. When price is above both moving averages and they're sloping upward, you have an uptrend.
Moving average crossovers generate entry signals. When the 20-period crosses above the 50-period, that's a bullish signal. The opposite crossover is bearish. But don't trade every crossover.
Momentum indicators like RSI (Relative Strength Index) and MACD show when gold is overbought or oversold. RSI above 70 suggests overbought conditions. RSI below 30 suggests oversold.
Hedging and Risk-Reward Ratios
Hedging protects your portfolio during gold price declines. If you own stocks and they're correlated with equity market crashes, adding gold exposure hedges that risk.
Your risk-reward ratio determines trade viability. Before entering any trade, calculate your potential loss versus potential gain. A 1:2 risk-reward ratio means you're risking $100 to make $200.
Most traders skip this calculation and enter trades emotionally. That's why most traders lose. Calculate your risk-reward before entering. If it's below 1:1, don't trade.
Automated Gold Trading: Removing Emotion from Execution
Manual trading requires constant monitoring. Automated trading removes the emotional component and executes your strategy mechanically. For busy professionals, automation is the only way to participate in gold markets consistently.
Automated systems trade the best gold trading strategy without hesitation, fear, or greed. They execute entries and exits exactly as programmed. They don't second-guess themselves during drawdowns.
Copy Trading and Verified Performance
Copy trading lets you mirror professional traders' positions into your MetaTrader 5 account automatically. You see their trades execute in real-time. Your account moves with theirs proportionally.
The critical factor is verification. Any system claiming returns without third-party verification is unreliable. Look for systems verified on MyFXBook or similar independent tracking platforms.
SonicAi Gold provides an automated copy-trading strategy specifically designed for gold (XAUUSD) markets, allowing investors to mirror trades directly into their MetaTrader 5 accounts.
Backtesting and Live Market Validation
Backtesting shows how a strategy performed historically. It's useful for validation but doesn't guarantee future results.
Live market validation is the only proof that matters. A strategy performing well in live markets right now proves it adapts to current conditions. Historical backtests are interesting but secondary.
When evaluating automated systems, ask for live trading records. How long has it been running live? What was the maximum drawdown? What's the win rate?
Macro-Economic Factors Driving Gold Prices in 2026
Gold prices don't move randomly. They respond to specific macro-economic drivers. Understanding these drivers helps you anticipate price moves before they happen.
Central Bank Policy and Interest Rates
Central banks control interest rates. Higher interest rates reduce gold's appeal because bonds and savings accounts offer better returns. Lower interest rates increase gold demand as investors search for yield.
In 2026, central bank policy remains the primary driver of gold prices. Watch Federal Reserve announcements, European Central Bank decisions, and Bank of England policy shifts.
The relationship is direct: when central banks signal lower rates ahead, gold rallies. When they signal higher rates, gold declines. This relationship has held consistently throughout 2026.
Currency Devaluation and Safe-Haven Demand
Gold is priced in US dollars. When the dollar weakens, gold becomes cheaper for international buyers, increasing demand. When the dollar strengthens, gold becomes more expensive, reducing demand.
Currency devaluation also increases gold's appeal as a safe-haven asset. During geopolitical crises or economic uncertainty, investors move money into gold.
Geopolitical risk in 2026 remains elevated. This safe-haven demand provides a price floor under gold. Even when fundamentals suggest weakness, geopolitical tension can reverse downtrends quickly.
Building a Consistent Gold Trading Plan
A trading plan documents your strategy, risk rules, and entry/exit criteria before you trade. Without a written plan, you'll make emotional decisions during live trading.
Drawdown Management and Win Rate Expectations
Drawdowns are inevitable. Even the best gold trading strategy experiences losing periods. A 10-15% drawdown is normal.
The key is managing drawdowns psychologically. Know in advance how you'll respond to a 15% loss. Will you stop trading? Reduce position size? Continue as planned? Decide this before it happens.
Win rates vary by strategy. Day trading typically generates 55-65% win rates. Swing trading generates 45-55% win rates. Automated systems can generate high win rates because they're disciplined and remove emotion.
Monitoring Performance and Adjusting Strategy
Track every trade: entry price, exit price, profit/loss, reason for entry, reason for exit. This data reveals patterns.
Review your trades monthly. Calculate your win rate, average win size, average loss size, and risk-reward ratio. Compare these metrics to your plan.
The best gold trading strategy for 2026 is one you can execute consistently and stick with during drawdowns.
Choosing the right approach to gold trading depends on your time availability, risk tolerance, and market outlook.
Frequently Asked Questions
What is the best gold trading strategy for beginners in 2026?
Beginners should start with trend-following strategies using moving averages to identify direction, combined with clear support and resistance levels. Use a 2:1 risk-reward ratio minimum, if risking $100, target $200 profit. Keep position sizes small (0.01 lots or less on XAU/USD) and always use stop-losses. Many beginners succeed by starting with swing trading rather than day trading, as it requires less chart monitoring and reduces emotional decisions.
How does automated gold trading actually differ from manual strategies?
Automated gold trading removes emotional decisions during volatile sessions, the system executes entries and exits without hesitation when conditions are met. Manual traders often abandon strategies during drawdowns or hold losing positions hoping for recovery. Verified automated systems, such as those independently tracked on MyFXBook, can demonstrate consistent win rates and drawdown limits because they follow rules without exception. However, automation only works if the underlying strategy itself is sound and backtested across different market conditions.
What gold trading indicators work best for XAU/USD in volatile markets?
Moving averages (50 and 200-period) identify trend direction reliably. RSI (Relative Strength Index) signals overbought/oversold conditions. MACD confirms momentum shifts. In 2026's volatile environment, combining these with support/resistance levels from recent price action outperforms single-indicator strategies. Avoid over-relying on one indicator, use 2-3 together to confirm signals. Volatility itself is an indicator: higher spreads during geopolitical events mean wider stop-losses are needed, reducing position size accordingly.
Is day trading or swing trading better for gold in 2026?
Day trading gold suits professionals with dedicated chart time and tight risk management, you capture intraday volatility but face higher spreads and slippage. Swing trading (holding 2-5 days) works better for busy professionals, as it requires less monitoring and plays into gold's macro trends driven by central bank policy and currency devaluation. Swing trading also allows larger positions relative to account size because stop-losses can be wider. Choose based on available time and emotional tolerance for overnight risk.